The moisture content of wood is directly related to the humidity and temperature of the surrounding air. The equilibrium moisture content (EMC) occurs when the wood has reached an equilibrium with its environment and is no longer gaining or losing moisture. Here is a calculator for computing the EMC of wood at or below the fiber saturation point (about 28% moisture content) given the temperature and relative humidity. This calculator uses average values and the results will be applicable to wood of any species for most practical purposes.
EMC Chart
The table below provides EMC values for a fairly representative range of atmospheric conditions that wood is likely to be exposed to. Values in this table are applicable to wood of any species for most practical purposes.
| Relative Humidity % | Ambient Air Temperature - degrees Celsius and Fahrenheit (Celsius rounded to nearest degree) |
||||||||||
| C: | -1 | 4 | 10 | 16 | 21 | 27 | 32 | 38 | 43 | 49 | 54 |
| F: | 30 | 40 | 50 | 60 | 70 | 80 | 90 | 100 | 110 | 120 | 130 |
| 5 | 1.4 | 1.4 | 1.4 | 1.3 | 1.3 | 1.3 | 1.2 | 1.2 | 1.1 | 1.1 | 1.0 |
| 10 | 2.6 | 2.6 | 2.6 | 2.5 | 2.5 | 2.4 | 2.3 | 2.3 | 2.2 | 2.1 | 2.0 |
| 15 | 3.7 | 3.7 | 3.6 | 3.6 | 3.5 | 3.5 | 3.4 | 3.3 | 3.2 | 3.0 | 2.9 |
| 20 | 4.6 | 4.6 | 4.6 | 4.6 | 4.5 | 4.4 | 4.3 | 4.2 | 3.0 | 3.9 | 3.7 |
| 25 | 5.5 | 5.5 | 5.5 | 5.4 | 5.4 | 5.3 | 5.1 | 5.0 | 4.9 | 4.7 | 4.5 |
| 30 | 6.3 | 6.3 | 6.3 | 6.2 | 6.2 | 6.1 | 5.9 | 5.8 | 5.6 | 5.4 | 5.2 |
| 35 | 7.1 | 7.1 | 7.1 | 7.0 | 6.9 | 6.8 | 6.7 | 6.5 | 6.3 | 6.1 | 5.9 |
| 40 | 7.9 | 7.9 | 7.9 | 7.8 | 7.7 | 7.6 | 7.4 | 7.2 | 7.0 | 6.8 | 6.6 |
| 45 | 8.7 | 8.7 | 8.7 | 8.6 | 8.5 | 8.3 | 8.1 | 7.9 | 7.7 | 7.5 | 7.2 |
| 50 | 9.5 | 9.5 | 9.5 | 9.4 | 9.2 | 9.1 | 8.9 | 8.7 | 8.4 | 8.2 | 7.9 |
| 55 | 10.4 | 10.4 | 10.3 | 10.2 | 10.1 | 9.9 | 9.7 | 9.5 | 9.2 | 8.9 | 8.7 |
| 60 | 11.3 | 11.3 | 11.2 | 11.1 | 11.0 | 10.8 | 10.5 | 10.3 | 10.0 | 9.7 | 9.4 |
| 65 | 12.4 | 12.3 | 12.3 | 12.1 | 12.0 | 11.7 | 11.5 | 11.2 | 11.0 | 10.6 | 10.3 |
| 70 | 13.5 | 13.5 | 13.4 | 13.3 | 13.1 | 12.9 | 12.6 | 12.3 | 12.0 | 11.7 | 11.3 |
| 75 | 14.9 | 14.9 | 14.8 | 14.6 | 14.4 | 14.2 | 13.9 | 13.6 | 13.2 | 12.9 | 12.5 |
| 80 | 16.5 | 16.5 | 16.4 | 16.2 | 16.0 | 15.7 | 15.4 | 15.1 | 14.7 | 14.4 | 14.0 |
| 85 | 18.5 | 18.5 | 18.4 | 18.2 | 17.9 | 17.7 | 17.3 | 17.0 | 16.6 | 16.2 | 15.8 |
| 90 | 21.0 | 21.0 | 20.9 | 20.7 | 20.5 | 20.2 | 19.8 | 19.5 | 19.1 | 18.6 | 18.2 |
| 95 | 24.3 | 24.3 | 24.3 | 24.1 | 23.9 | 23.6 | 23.3 | 22.9 | 22.4 | 22.0 | 21.5 |
| 98 | 26.9 | 26.9 | 26.9 | 26.8 | 26.6 | 26.3 | 26.0 | 25.6 | 25.2 | 24.7 | 24.2 |
EMC by U.S. location
The moisture content of wood should be matched as closely as is practical to the equilibrium moisture
content (EMC) conditions in service. The table below shows the EMC conditions in outdoor exposure in various U.S. cities for each month.
Equilibrium moisture content of wood, exposed to outdoor atmosphere, in U.S. locations
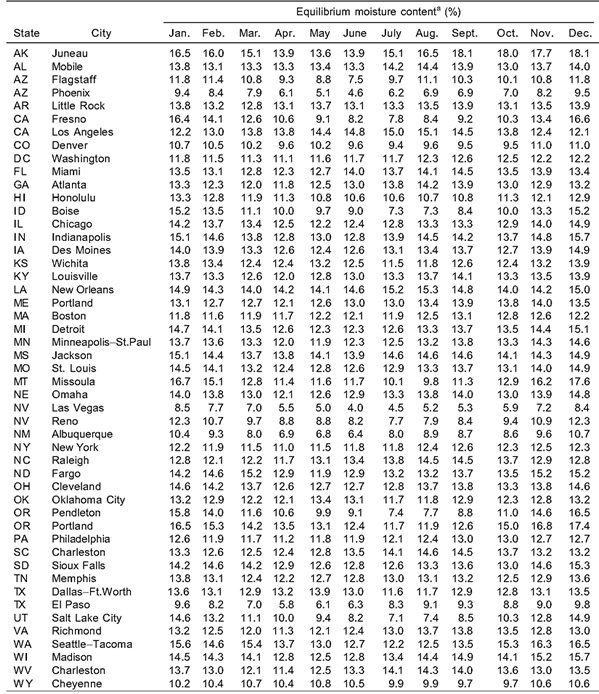
EMC values were determined from the average of 30 or more years of relative humidity and temperature data available from the National Climatic Data Center of the National Oceanic and Atmospheric Administration. 1997 data.
